Propagation at 50MHz
Issue 61Six News, May 1999
By Ray Cracknell G2AHU, Chris DEacon G4IFX & Ian Brotherton G2BDV
T
his article is an edited version of a report produced for the Propagation Studies Committee of the Radio Society of Great Britain, 11th September 1998. A fuller version of the paper can be found on the Internet at http://www.quercus.demon.co.uk/a6mAbstract
A practical evaluation of the diurnal and seasonal variations in tropospheric propagation at various distances overland is described. To gather the necessary data, a 50 MHz transmitting station beaming south was established as far north in England as possible. It worked for 24 hours a day for more than a year while monitoring stations were set up in the Midlands and near the South Coast.
The survey was completed during 1996-1997 and the stations and their findings are discussed. It is surprising that although abnormal conditions are fully understood, the much more reliable normal mode of tropospheric propagation has received very little attention. Yet conditions suitable for medium distance communications are known to exist. We advance an hypothesis which we hope will serve as guide-lines towards the development of an acceptable theory.
The Background
Personal interest in tropospheric propagation goes back to the early years of World War Two when G2AHU was warned to stand by to go out to the Far East to investigate UHF ducting between Pacific islands. The project fell through but the interest remained and in recent years has focussed on VHF.
The British Broadcasting Commission’s Research Department were experimenting with VHF before the war, and Rowden et al (1959) [1] wrote: "In 1932 an experimental transmitter operating on a wavelength of 7. 75 metres (38. 7 Mc/s) was set up in Broadcasting House, London to investigate the use of such frequencies for broadcasting. At this early date the observations of the range were mainly qualitative and consisted in reporting whether or not a signal was received at distances of up to 100 miles. With the inauguration of the television service in 1936 reports of reception began to be quite regularly received from distances up to 200 miles."
Figure 1. Location of GB3IFX and the observed service area of transmissions
Wartime experiences, especially with radar, led to much activity in the post-war period. On 8th April 1946, Sir Edward Appleton [2] at a Conference at the Royal Institution read a paper on "The influence of ionospheric conditions on ultra short wave propagation" and spoke of "the frequent existence of a horizontal stratification of the atmosphere, characterised by marked variability in temperature and water-vapour content…" and "clearly the most marked negative gradients of atmospheric refractive index with height are obtained when there occurs a strong temperature inversion and a rapid lapse rate of water vapour."
 Figure
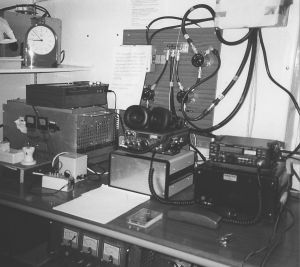
2. Flight Refuelling Amateur Radio Society VHF Shack, G4RFR
Figure
2. Flight Refuelling Amateur Radio Society VHF Shack, G4RFR
Report K-140 of the BBC’s Research Department, 1959 [3] refers to the "abnormally high signal strength" during such periods as Appleton described as "anomalous propagation", but pays little attention to the seemingly "continuously present" signal. They were interested primarily in the percentage of time that strong signals, which were liable to cause interference between TV transmitters, were present. Excellent though the series of reports was, the transmissions on 180. 4 MHz were from yagi antennas on TV transmitting masts 119 to 179 metres above ground, and therefore were not really comparable with results that amateurs can expect from the antennas permitted in their gardens. Nevertheless the recordings of normal and abnormal propagation together with the appropriate refractive index height profiles contained in the Report K-140 are most interesting.
Amateurs normally do not have immediate access to data from which the refractive index can be calculated. Although G3LTP (1961) [4] discussed the application of a "potential index", it is more practical to study normal middle distance VHF tropospheric propagation at say 50 MHz where it is less likely that abnormal propagation will occur. In 1964 ZE2JV (now G2AHU) [5] set up a 50 MHz tropospheric experiment over a 248 km path from north of Salisbury (now Harare, Zimbabwe) to Gwelo (now Gweru). He found that the receiving station, designed using text book calculations for the strength of signals to be expected, had to be modified in the field by aligning the 4 element yagi receiving antenna 40 degrees off the direct bearing, reducing the signal by 6 dB to prevent overloading the Rustrak recorder. Further, in 1984-1986, the six-monthly reports that the early 50 MHz permit holders were required to submit, and which were analysed by G2AHU, indicated that contacts spanning the British Isles, including Land’s End to John o’ Groats, took place regularly.
Figure 3a. Diurnal variation in signal strength and reliability at G2AHU, averaged monthly, January to June.
In amateur literature, more recent publications have changed the "normal propagation" of the BBC Reports to "scatter propagation". G3YGF (1981) [6] in his RadCom article, "Tropospheric Scatter Propagation", used conventional theory to illustrate propagation at 10 GHz very thoroughly, but its application to 50 MHz may be limited as the size of object required for any diffraction is directly related to the wavelength.
OZ1RH (1996) [7] in "Troposcatter at 50 MHz : 700 km QSO’s any time" asserts that "Troposcatter is always there 365 days and nights a year". Doubts (on the one hand from the under-estimation in the past and on the other hand from the over-estimation of OZ1RH) as well as the discouragement due to the use of the mode for military back-up communications, all point to the need to investigate a mode which users of VHF often employ without realising it.
The aim of the first phase of our investigation was to measure the signal strength and reliability of a 50 MHz signal over several hundred kilometres for 24 hours per day for over a year, under transmitting and receiving conditions normally applicable to radio amateurs.
Figure 3b. Diurnal variation in signal strength and reliability at G2AHU, averaged monthly, July to December.
The Experiment
The 50 MHz transmitter used for the experiment was the one normally used by G4IFX for his other amateur activities, and the transmissions consisted of a 30 second CW call on 50. 275 MHz, on the hour, every hour, 24 hours per day.
The transmitting antenna consisted of two stacked six-element yagis beaming due south from Darlington (IO94FM) giving coverage as illustrated in Fig. l. Reports were at first received from many amateur stations. Full time monitoring was conducted at Yarpole in northern Herefordshire by G2AHU, at a distance of some 264 km while tests were also conducted at a distance of 100 km by G0DJA in Wakefield, at 418 km by G2BDV and at 420 km by G4RFR, both in Wimborne.
Figure 4. Monthly average signal strength at G2AHU
Figure 5. Running average signal strength at G2AHU
Figure 6. Reliability of reception at G2AHU
Tests were made on high and low power. 30 watts into the antenna was the normal level, and high power was available at 400 watts for testing purposes.
The design of the experiment took into account economy of power usage and band occupation, the freeing of the equipment for normal amateur work for 59 minutes every hour, and the need to provide sufficient data so that ordinary tape recorders and receivers could run for three days without attention.
G4IFX had programmed a BBC computer to control the transmitter and to generate the call sign and the time, which was very useful in checking the recordings. The BBC model "B" is very old technology by modern standards, but is easy to program and has a built-in TTL interface capable of driving the keying line of the transmitter via a single transistor. The program was a modified version of one written for high-speed CW transmission by Paul Turner, G4IJE, in the early Eighties. It was modified to generate hand-speed CW with a control loop to trigger the transmission on the hour, every hour, and to transmit the beacon text, which included the time. An empirical linear correction was added to improve the otherwise inadequate accuracy of the BBC computer’s built-in clock.
Crystal controlled timers were developed to switch on receivers and recorders at the appropriate times and these were designed to function within an accuracy of plus or minus two seconds per week, and in practice the one at G2AHU ran for 14 months without adjustment. It was run off float-charged batteries in case of mains failure or accidental switch off. The results were analysed monthly and published in the Six and Ten Reports by the Propagation Studies Committee of the RSGB.
The receiver used was home-built and used dual-gate mosfets in the pre-amplifier and RF stages, with an SLB1 double-balanced mixer to a 9MHz crystal filter and IF, and a 300Hz active audio filter in the original receiver. An MC145151 "‘synthetic crystal" PLL unit replaced the VFO and a fraction of the AF output was fed to a tape recorder. The unit ran 24 hours every day for two years and a timer was employed to switch on the receiver and tape recorder for 30 seconds every hour in synchronism with the transmitter.
The timer used a 1 MHz crystal in a 4007 oscillator, 4017 dividers down to 1 pulse per hour, and a 555 timer adjustable to the required recording time. The power supply was from a trickle-charged accumulator stabilised at 12. 5 volts, which proved essential in an area with a none-too-reliable mains supply at the time of the tests.
While waiting for the Regulatory Authority’s approval for non-attended operation, weekend tests were commenced in September 1995 when G4IFX was at home. A beacon licence as GB3IFX was eventually issued; full-time operation commenced on 3rd August 1996 and continued uninterrupted until 30th September 1997. The frequency was chosen by G4IFX after consulting neighbouring amateurs using the 50 MHz band and the forethought was rewarded by not a single occurrence of interference from amateurs on the frequency throughout the tests.
As tests showed that the reception of GB3IFX at G4RFR was on the average 24 dB better than at G2BDV’s home location, the Wimborne tests were conducted from there with the kind permission of the Flight Refuelling Amateur Radio Society. The shack layout at G4RFR is illustrated in Fig. 2.
Results Achieved
For reasons of space this edited version of the paper concentrates on results at G2AHU, with the exception of the G4IFX fading trial (see later). Readers can refer to the full version of the paper (via the Internet) for the results at other monitoring stations.
All the transmissions from Darlington were monitored at G2AHU in Yarpole. Results were normally transcribed daily although the recording system worked satisfactorily if unattended for a few days. At the end of each month the average percentage reliability for each hour was calculated on the basis of the number of days when a signal was heard divided by the total number of valid tests multiplied by 100. On Sunday mornings any outages were confirmed with G4IFX by radio. Signal strengths were averaged for each day as well as for each hour throughout the month. Results were maintained during the trial period September 1995 to August 1996 and were very useful for comparison with the full-time results. The tests were continued for an extra month as results during May to July 1997 were below expectations. The extra September test indicated that there was no significant deterioration in equipment during the testing periods.
Signal strengths were recorded using a modified version of the RST code. The diurnal variations in signal strength and reliability of GB3IFX at G2AHU, for each month of the year are illustrated in Figs. 3A and 3B on pages 30 and 31.
The monthly average signal strengths for all tests covering a two-year period from September 1995 to September 1997 are illustrated in figure 4 on page 32. A three-month running average has also been applied to obtain a monthly variation, from which predictions could be made. The resulting graph appears in Figure 5.
Although when considering signal strength it was thought to be of value to compare an abnormal year (1997) with figures obtained from what amounted to testing 2. 5 days per week, in the case of the reliability figures it would have been unwise to do so. Signal strengths were calculated from the strength when heard and therefore are not unduly influenced if there is a bad period between tests. But with reliability, a bad period not taken into account would make a considerable difference. Fig. 6 on page 33 shows the seasonal variation in reliability from October 1996 to September 1997, and the depressed conditions during May to July 1997.
The graph shows minima in February and November with a maximum in August. The May to July 1997 figures, like the signal strength figures, were depressed by prolonged unusual weather conditions. The recovery in the December to January mid-winter period is interesting as it is a time when descending air is likely to meet turbulent moist air leading to changes in the refractive index which bring dramatic improvements in tropospheric propagation at higher VHF frequencies.
Weather and Propagation conditions
A record was kept of weather forecasts covering the period of full testing and those from the Daily and the Sunday Telegraph were used. Manchester was very close to the mid-point of the great circle route from Darlington to Yarpole and it is these figures, inferred from the weather maps, that were used to investigate the relationship between the weather and propagation conditions.
Comparing the temperature and pressure data for the best days with that for the worst days shows no significant differences between them. But although cloudy weather does not seem to be a reliable indicator, it does seem that it was more likely to rain when conditions were poor for propagation.
Nevertheless in December 1996,S9 signals from GB3IFX were being received during a heavy snowstorm and a cold front aligned along the propagation path. On another occasion, a light breeze from 018 degrees (ie along the path), was found to produce very good signals.
Anomalous Propagation
An exceptional recording of signal strength occurred during the night of 14th/15th November, with signals up to S9 for hours at a time. This anomalous opening, and another from 2100 on 7th until 1300 on 10th December 1996, suggests that we cannot discount the possibility of discontinuities in the refractive index with height being deep enough to refract even a 50 MHz signal sufficiently. In other words, that ‘normal’ tropo ducting was taking place.
The BBC Report K-140 reported that in1954 - 1956, "Abnormally high signals are usually received during anticyclonic weather conditions either in summer or winter." Pressure was certainly high on 14/15 November 1996 with the centre of an anticyclone south-west of Ireland and a warm front aligned from Darlington to Yarpole with rain forecast, and pressure falling to 1016 mB on the 15th.
The 7th December brought high pressure with an anticyclone to the south-west of Ireland again. Fog and mist with low wind and pressure rising were forecast. General mist on 9th and circulating light winds continuing on 10th, with the high pressure moving away to the north east, and temperatures of 2C to 7C prevailed with warm air brought in from the Atlantic and cold air being pushed out.
Even if conventional layer discontinuities were not sufficient, in both cases it is evident that the mixing of warm Atlantic air and cold drier air must have been the cause. In August 1997 conditions were so good that any "anomalous" conditions could well have passed without notice.
The G4IFX Fading Trial
The purpose of the fading test carried out on 13th April 1997 was to examine simultaneous variations in signal strength at Yarpole and Wimborne. This was achieved by G4IFX using the same rig and antenna as GB3IFX but with a linear amplifier supplying 400 watts input to the antenna.
The test took place from 1000 to l030z. The transmitter sent a series of dots for30 minutes, with the callsign every 15 minutes, at a speed of 12 wpm. G3PFM operated G4RFR as in previous experiments, and G2AHU and G2BDV operated their own stations. All three noted the signal strength every minute of the tests. We did not anticipate that the results at G4RFR and G2AHU would vary in synchronism (and we should have had to alter our ideas of the mechanism involved if they had synchronised) however we expected results at G4RFR and G2BDV, only 2.07 km apart, to be similar.
Figure 7. Synchronised recordings of signals from G4IFX received at G4RFR, G2AHU and G3BDV, 13th April 1997.
The results from G2AHU,G4RFR and G2BDV are plotted in Fig. 7 overleaf. There is only limited similarity between the fading patterns between G2AHU and G4RFR, but the average signal strengths were very similar with 6.1 from G2AHU and 6.0 fromG4RFR. It is evident that the short-term fading patterns show that the signal at G2AHU shows considerably greater variation than that at G4RFR although the average is very similar with G4RFR being slightly better.
It is interesting that the monthly average for the 30 minutes were for G4RFR = 4.3 and G2AHU = 4.4 and that both recorded a 1.7 S-point rise for the 11.25 dB increase in transmitter power which was a result that was as accurate as could be expected.
The average signal at G2BDV was 3.4 S-points or 16 dB lower than G4RFR. The correlation between the curves at G2BDV and G4RFR is not as close as we expected but this may be attributed to the low level of the signals at G2BDV, where signals were often at a QSA 1 or 2 level where variations in noise can have a considerable effect. The differences between the locations of G4RFR and G2BDVconfirm the great importance of a low angle of take-off although screening behind higher ground is nothing like as complete as it was thought to be. In initial tests G4RFR had shown a 3.6 S-point advantage compared with a 3.4 S-point advantage in the fading tests.
A Comparison with Sub-tropical Conditions
In 1963 a 50 MHz beacon, ZE1AZC, built by Dr Fred Anderson, ZS6PW, was installed on a hilltop near Mazoe 40 km north of Salisbury, now Harare the capital of Zimbabwe. The beacon ran 40 watts ouput power FSK with a break for recognition purposes during automatic recording. Signals were monitored from a site 248 km away, near Gwelo (now Gweru).
The experiment ran for 30 days in the middle of the dry season. Mid-winter conditions brought frost at night, dew in the early mornings, and brilliant sunshine during the daylight hours. The purpose of the experiment was to assess whether HF or VHF provided better communications over medium distances and showed that VHF was much better than HF (the HF tests used the ZE1AZD beacon on 1.8 MHz).
Comparing the ZE1AZC results [5] with our Darlington-Yarpole results we find:
a. The reliability and signal strength results are similar if daily averages are taken.
b. The pattern of diurnal variations is almost reversed. In Britain, except for late summer, daytime conditions are much better than at night, with a minimum at 0100 to 0200z, being the normal pattern. In Zimbabwe conditions were better during the night and reached a minimum at 1400 local time. The differences appear to lie in the re-radiation of heat by the earth and the availability of moisture to be absorbed by the rising air. It will however be appreciated that the beautifully clear, bright, sunny days typical of the winter dry season quickly evaporate off the dew and that by mid-day the countryside is parched.
Conclusions
We have established that the low level of background signal, often referred to in the literature describing abnormal events, is not always present at a steady level but varies widely over short time periods and exhibits pronounced seasonal and diurnal variations.
To use an analogy with light, the concept of radiation from antennas at each end of the propagation path ‘illuminating’ a common volume is undoubtedly valid. But it is evident that, at the longer wavelength end of the VHF spectrum, G3YGF’s "reliable reflections… …from dust particles or clouds", are most unlikely.
If it is to be affected by refractive index changes, the transmitted wave must encounter air masses differing in moisture content. The change in the refractive index must be sufficient in size and depth to bend the signal downward towards the receiver. At a wavelength of six metres this is unlikely to be occasioned by minor turbulence, and certainly not by dust.
G3YGF goes on to say: "A very small fraction of the power passing through this volume (‘illuminated’ by the two beams) will then be scattered in all directions by the irregularities in the atmosphere, and some of it will be in the direction of the receiver". This is a definition of true scatter. The horizontal beamwidth of a typical six-metre yagi is wide, say 40 degrees to half power points. This means that in the case of ‘true’ scattering at 50 MHz, the volume ‘illuminated’ by the transmitting and receiving antennas would be so wide in a horizontal plane that beams would lose their sense of directivity.
Signals recorded in our tests were frequently far too strong to be classified as ‘scatter’. As a result we are currently of the opinion that the use of ‘scatter’ in the name of the propagation mode is not appropriate. We prefer the BBC terminology of ‘normal’ tropospheric and ‘abnormal’ or ‘anomalous’ propagation for extraordinarily strong signals. Of course we are not disputing that scatter propagation, as G3YGF describes it, takes place at 10 GHz and higher when the analogy with the diffusion of light becomes more appropriate, but we do not believe that it operates at 50MHz over the distances we have investigated.
The diurnal variation in signal strength tends to be controlled by the time of sunrise and sunset, although, like the seasonal variations, maxima and minima always lag on the sun’s timing. This would seem to indicate that it is re-radiated heat from the earth rather than the sun’s direct effect on the atmosphere that is important. Seasonal variations show a maximum in August and a minimum in February or March. In August, night-time conditions generally remain good with reliabilities above 80%, and at other times conditions decline slowly after sunset. Even in mid-winter, conditions remain good at mid-day and (as illustrated previously), sometimes provided remarkably good night-time conditions. A surprising feature is that conditions show a small peak of improvement in mid-winter and at midnight.
Fading patterns are numerous. At times the signal builds up over two or three hours then disappears as if the reflecting medium moves into the optimum position and is then cut off. At other times, reflections occur from several places giving deep and fairly rapid variations in signal strength. On 50 MHz, flutter fading is rare and seldom detectable on CW whereas on 144 MHz over the same circuit it is often noticeable on CW and troublesome on SSB. This is in keeping with the assumption that a signal on 2 metres will be affected by smaller and therefore more numerous atmospheric variations than on six metres.
Our findings regarding the relationship between weather and propagation are very similar to previous findings. Although the average seasonal and daily variations are predictable, they can be upset by abnormal weather conditions. Daily weather forecasts are of very little use in predicting propagation conditions, so listening to a beacon maybe 200 km away will always provide a better indication.
The much steadier signal at Flight Refuelling than at G2AHU in Yarpole can be accounted for by the less restricted transmission path, so that the antennas at G4RFR (Flight Refuelling) and GB3IFX ‘illuminated’ a much greater common volume of air than between G2AHU and GB3IFX.
The lack of correlation between short term fading during tests carried out between GB3IFX, with G2AHU and G4RFR demonstrated that relatively small areas are responsible for the necessary refraction. The distance between the mid points of the two paths, GB3IFX - G2AHU and GB3IFX - G4RFR, is of the order of 80 km so we can say with certainty that the size of the refracting areas must be significantly less than that.
In order to refract a VHF radio wave of a given wavelength from the troposphere down towards the receiving antenna, key factors are the source of heating and its distribution through the atmosphere and the available moisture and the relative moisture content of adjoining volumes of air.
Conditions were poor from May to July 1997, when the weather was very dry. Afternoon conditions over the parched veldt of Zimbabwe were poor. These observations show that moisture is a necessary ingredient; clearly a negative gradient of the atmospheric refractive index can only be found where there is a rapid lapse rate of water vapour.
The random chance of finding an area with a rapid lapse rate of water vapour within the ‘volume’ of air illuminated by both transmitting and receiving antennas appears to determine the reliability of tropospheric propagation. It follows therefore that the greater the volume so ‘illuminated’ the greater the probability of successful propagation and when operating in a location where the take-off is restricted, reliability suffers and fading is more pronounced.
The Hypothesis
We regard the experiment now completed as a qualitative assessment of a propagation mode that has not been properly explained. From it we have to frame an hypothesis as a basis for further work.
Tropospheric propagation depends on radiation from the sun, but the atmosphere absorbs very little heat directly from solar radiation so that it penetrates and heats the surface of the earth, causing it to re-radiate heat at a lower frequency. Air that is in contact with the surface is heated by conduction, which in turn heats the air above it by convection. When air is heated it can absorb more moisture as water vapour (providing it is available). The heating also causes the air to expand, to become less dense, and to rise.
As height increases the atmospheric pressure reduces and the rising air expands further. It consequently cools by about one degree Celsius per 100 metres of altitude, increasing the relative humidity until the air becomes saturated. The upward movement continues until the rising mass of air, similar to a giant bubble, reaches surrounding air of the same density. If the air continues to rise and cool after it becomes saturated precipitation will take place in the form of water drops, as fog, cloud, rain or even snow or hail.
These rising ‘bubbles’ of air are called thermals. Gliders and large birds of prey use them by circling around them and being lifted up into the upper atmosphere. Passengers in light aircraft, before the advent of jet airliners, became airsick on bumpy journeys. The existence of thermals is not in doubt. They are more common during the day and during hot weather and vary considerably in size according to the physical factors that determine their formation.
These physical considerations are the basis of our hypothesis. The physical size and the seasonal and diurnal variations of thermals point to the likelihood that they are the mechanism for which we are searching.
Terman, in the classic text Radio Engineering published in 1947 [9], states that: "Tropospheric reflections are caused by small discontinuities in the dielectric constant of the air existing at boundaries of air masses of different characteristics, which can result in reflection coefficients of the order of 10
-3 to 10-4 and occur at heights of 1km to 10km…" Our contention is that these ‘small discontinuities’ are brought about frequently (but not exclusively) by rising thermals heated by re-radiation from the earth’s surface.G3LTP in the Radio Communication Handbook wrote that: "The essential part of the process is that descending air must meet turbulent moist air before it becomes effective as a boundary". But what we are suggesting is that warm moist air is, in the case of thermals, rising to meet colder less humid air in the upper atmosphere. Although G3LTP wrote that, "… ascending air on its own never leads to spectacular conditions", it is not the spectacular with which we are concerned. Instead we are looking for a mode which, if it is not there "365 days and nights a year" as OZ1RH asserts, is there for a very large portion of the time that amateurs wish to use it.
Our hypothesis is therefore that: normal tropospheric propagation at 50 MHz takes place largely through the refractive index changes occasioned by rising moisture-vapour laden thermals.
The purpose of formulating a hypothesis is of course to have a theory, the proving or disproving of which will guide the next phase of the study.
Acknowledgements
We wish to thank Mr CE Newton, G2FKZ and Mr AHB Bower, G3COJ for help in obtaining reference material, Mr JT Ault, G3KTU and Mr AJ Baker, G3PFM from Bournemouth and Poole, and all those who participated in the study.
References1. Rowden RA, Tagholm LF and Stark JW,"A survey of tropospheric wave propagation measurements by the BBC1946-1957", IEE Paper No. 2517, 1958
2. Appleton, Sir EV, "The influence of tropospheric conditions on ultra-short-wave propagation", report of a conference on meteorological factors in radio wave propagation, Royal Institution, London, The Physical Society, 1946
3. Stark JW, Green KH, Ashdown SJ, Caine JW and Rhodes I, "Long distance overland propagation measurements at l80.4 Mc/s", Report No. K-140, Engineering Division, BBC, 1959
4. Flavell RG and Lane JA "The application of potential refractive index in tropospheric wave propagation", Journal of Atmospheric and Terrestrial Physics, Vol. 24, pp. 47-56, 1952
5. Cracknell RG, "Medium distance propagation in a tropical zone". Restricted military circulation, Salisbury, Rhodesia 1964
6. Gannaway JN, "Tropospheric scatter propagation", Radio Communications, August 1981, pp. 710-717
7. Preben-Hansen P, "Troposcatter at 50 MHz: 700 km QSOs any time", Six News, Issue 49, pp. 29-34 and issue 50, pp. 45-50
8. Flavell RG, "Tropospheric Processes", Radio Communication Handbook Sixth Edition, 11.20/21, RSGB
9. Terman FE, "Radio Engineering", Third Edition, New York & London 1947, p. 621
![]() To return to the archive page click here
To return to the archive page click here